|
Trace an IP address or website
IP Addresses, Domains and Host Name Basics All computers that access the Internet are identified by an IP (Internet Protocol) address which consists of 4 numbers separated by periods, for example 161.58.180.113. In the case of a website, the IP address represents a domain name (such as 'visualware.com'), which allows a computer to have a name that is easily recognizable and much easier to remember than an IP address. This is often referred to as the host name or domain name. When you enter a host name Visual IP Trace looks-up the IP address from a Domain Name Server (DNS), which is a bit like an Internet telephone directory. The DNS is then used to locate the details of the computer to be traced. Your computer has also been assigned an IP address, an IP address is necessary in order to browse the web, send email, or use any other Internet services. Many IP addresses are dynamic, meaning they are assigned temporarily from a block of addresses that has been allocated to an ISP or host provider. Dynamic IP addresses are used most often for dial-up Internet access, so that each time a dial-up user connects to the Internet, they are assigned a new IP address. IP addresses that are assigned on a permanent basis are considered static. ISPs normally keep logs of which users are assigned an IP address -- when reporting Internet abuse to an ISP it is important to note the day, time and time zone of the incident so that user can be determined. Visual IP Trace enables you to trace:
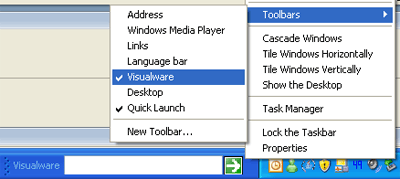
You may perform a trace analysis by using any of the 3 methods listed below. 1. Visualware Toolbar in the Windows Task Bar To add the toolbar, right click on the Windows task bar, and select Toolbars, Visualware, which will add the toolbar shown below.
Enter the IP address, domain or host name you want
to trace and click the green arrow to start a basic trace.
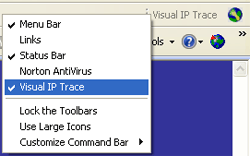
To add or remove the Visual IP Trace shortcut
from Internet Explorer toolbar, right click on the
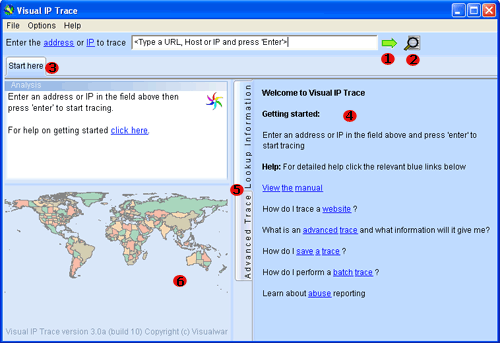
toolbar and select/deselect Visual IP Trace. Select Start, Programs, Visual IP Trace, Visual IP Trace The numbers above a referred to below: 1. Green Arrow/Address box - To initiate a basic trace enter the address or IP into the address box and click the green arrow. 2. Batch Trace (Advanced Edition Only) - If you wish to trace multiple IP's or addresses at once then choose this option. This option can also be accessed in the "File" menu. 3. Tabs (Advanced Edition Only) - Every time a new trace is started a new tab will open allowing multiple traces to be done at once. 4. Lookup Information - When a trace has started information such as domain and network whois will appear in this tab 5. Lookup Information and Advanced trace tabs - When an advanced trace has been initiated the advanced trace tab will show additional data and improve the accuracy of the location. 6. World map - The world map will display the end location of the trace you have performed. To initiate a trace simply enter an IP address or web address into the address box as shown in fig 2.1 above (bullet point 1) and click the green arrow. This will start a trace:
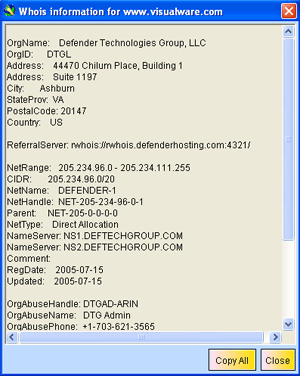
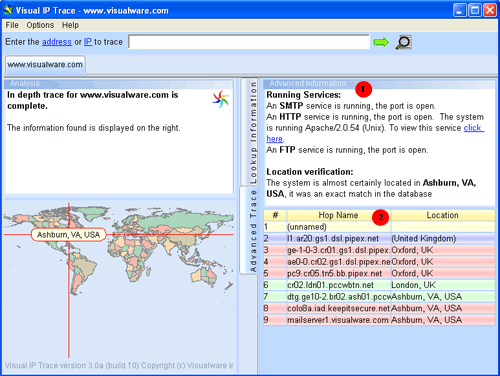
The basic trace performs the whois lookup and basic location match for the IP/address you entered. The whois information such as domain/network contact information, IP ad dress and location are displayed in the 'Lookup Information' tab on the right hand side. The initial location match is also shown on the world map. To perform an advanced trace click either the "clicking here" link or the "globe icon" as shown in red on fig 3.1 above. The number one in fig 3.1 above denotes the "click here" link in the lookup information tab. By clicking this you can view the unparsed whois information for either the network of the domain. example below:
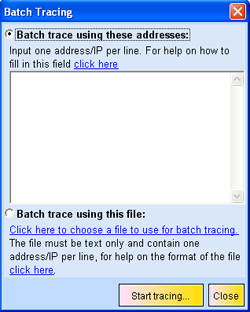
The number 1 denotes the advanced information such as which services are running on the destination machine and which system they are running. The number 2 denotes the trace route table showing the hop name and location of each hop along the route. The end location may change from the basic trace to the advanced trace as the advanced trace is more accurate and uses the advanced information to better judge the end location. The colored backgrounds in the route table are described below: -Green= 100% database match -Red=Whois match -Blue=Country level match -Purple=Continent match -Yellow=No match When using the advanced edition you can perform another basic/advanced trace whilst keeping your previous trace open. If you are using the standard edition then you may want to use the "File" --> "save" menu option to save your last trace. Batch Tracing (advanced edition only) To initiate a batch trace you can either go to the file menu and choose batch tracing. Or click the magnifying glass icon as shown above in fig 5.1. By choosing either of these options then following dialog box will appear:
There are two ways to batch trace. The first is by filling out the text box with the address/IP's you want to trace. The format is one IP/address per line. Once all the address/IP's have been added to the text box then click the "start tracing..." button. The dialog box will close and Visual IP Trace will start to trace all the address/IP's chosen. The second option is to have Visual IP Trace read a text file on your hard drive. The format for the text file is the same, one address/IP per line. To select the text file simply click the "click here to choose a file to use for batch tracing" link under the second option as shown in fig 5.2. The 'Start Silent Tracing...' option performs the batch trace in the background and records the information you want in a text file. To start silent tracing, enter the IP/domains you want to trace, or choose the file you want to trace from then click the Silent tracing... button:
Silent tracing will cause all the items in the batch file to be traced at once and the results written to a file. You can choose the details you want in that file using the check boxes shown in fig 5.3 above. During the trace a progress dialog will be displayed and Visual IP Trace will lock functionallity until the traces are completed. Bear in mind that performing the network whois and domain whois lookups will cause to extra files to be created per IP/domain. This will results in a lot of files if you are tracing many IP/domains. Make sure to select an output file (.txt) by clicking the 'Click here to select the output file' link. Once you are done click the 'Go' button. Once the traces are complete the output file may look similar to the one below in fig 5.4.
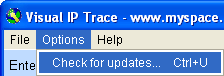
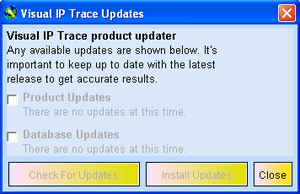
The check for updates option checks to see if there are any program updates or database updates. Database updates are important as the database provides the locations for every trace. The more out of date your database is the more inaccurate your traces will be.
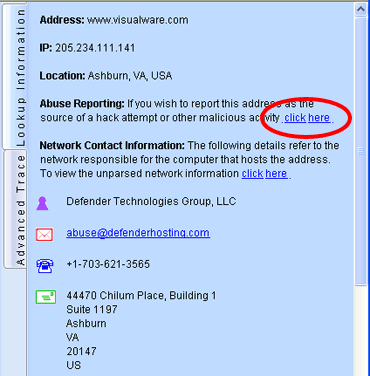
If updates are available they will appear in the dialog box. To install updates just check the box next to the update you want and then click the "install updates" button. This will download and install the updates automatically. Once and advanced trace has been completed for a trace then click the abuse report link as shown in fig 7.1 below:
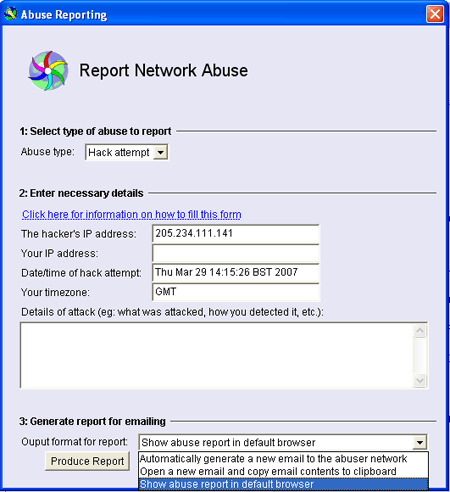
Once you have clicked the link the following dialog box will pop up:
To report spam or virus email:
To report a hacker attack:
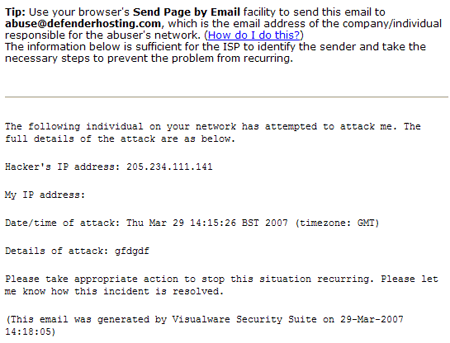
Send the Abuse Report web page by email:
If you should experience any problems please contact support |
 
|